Telemedicine will soon face a market explosion similar to social networking. The consequences are:
- significant increase in medical data requiring assessment
- massive resourcing challenge to clinical professionals
- need for tools that allow accurate and quick assessment
- increasing market of non-clinical users demanding easy-to-use interfaces and displays.
Sunics technology addresses these challenges by providing efficient, easy-to-use visualisation and assessment technology. This page illustrates some of the features in the case of ECG (electrocardiogram) data.
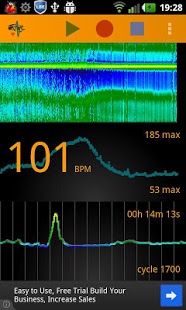
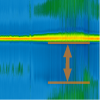
| Compact Overview: ECG data of several minutes to several hours length is visualised in a compact, yet detailed image.
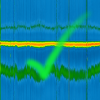
Ease-of-use: trends and events occurring in the data clearly appear as graphical features and can be detected even by non-clinical users, e.g. during self-monitoring. Visual aids highlighting features of clinical importance enhance this process further. |
|
|
Figure 1: examples of single-channel, long term ECG visualisations. Visual aids highlight important features. |
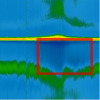
| Navigation Tool: Linked with the traditional 'stripe' representation, the compact overview delivers an efficient navigation tool for professional ECG assessment by trained clinicians. | |
|
Figure 1: interactive navigation tool assisting identification of candidate events and trends during assessment of a stress test ECG. Selection of known image patterns in the overview (right) links to corresponding strip segments (left). |
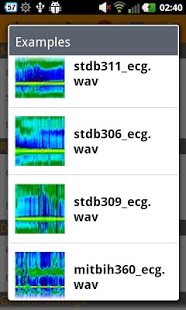
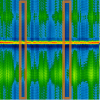
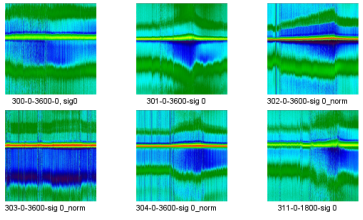
| Visual Fingerprint: characteristics of recordings are well represented as a visual 'fingerprint', allowing for quick and easy selection and comparison.
Comparable: Sunics decouple wave morphology and heart rate. This 'normalises' the ECG and provides the mathematical foundation for accurate comparison and metrics. |
 |
|
Figure 2: visual index of long term ECGs. (The same channel is shown for all recordings.) |
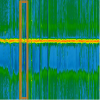
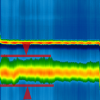
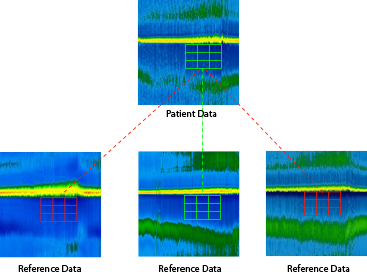
| Automated assessment: in combination with existing reference data, clinical patterns arising in patient ECGs can be categorised and compared for assessment.
Two-Dimensional: the unique rearrangement of heart cycles to two-dimensional data captures the full wave morphology over time. |
|
|
Figure 3: two-dimensional metrics applied to normalised ECG data improves assessment via matching of patient data against known references. |
More Information ![]() Presentation "ECG Visualization and Navigation"
Presentation "ECG Visualization and Navigation"
Cycloscope Cardio is a mobile application showcasing our ECG visualisation suitable for long-term monitoring. It allows users to perform real-time monitoring & recording and to share or view ECGs via common channels. ECG data can be streamed from Physionet or acquired via external bluetooth hardware in real-time.