
Applied to accelerometer data (or audio recordings) of rotating machinery, Sunics reveal aspects of the data which are hardly accessible via the time-waveform or spectrum. These include:
- localization of faults in time and phase
- slowly occuring changes (low frequency components)
 |
 |
|
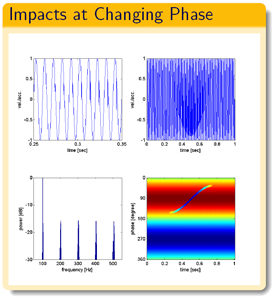
Example (simulated data): sunic (bottom right) clearly illustrates how a strong impact (blue curve) changes its phase (vertical axis) over time (horizontal axis). This is difficult to see in the time-waveform (top) and missing in the spectrum (bottom left).
|
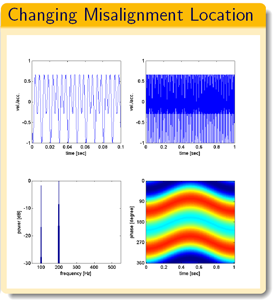
Example (simulated data): sunic (bottom right) clearly illustrates how the phase location of a misalignment slowly changes.
|
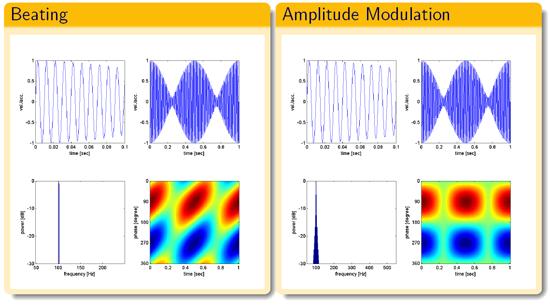
Sunics produce very detailed and distinctive patterns and thus allow a more detailed analysis of the vibration data than conventional methods.
 |
|
Example: simulated data for beating and amplitude modulations illustrate how sunics produce more distinctive patterns (bottom right) compared to spectrum (bottom left) and time-waveform (top).
|
More Information ![]() New Methods In Vibration Analysis (presentation held at VANZ 2006).
New Methods In Vibration Analysis (presentation held at VANZ 2006).