ECG Waveform Analysis
16 March 2011
A heartbeat is a periodic signal. Every beat has a shape — and that shape contains information about the health of the heart. Sunics makes that shape visible.
The Experiment
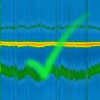
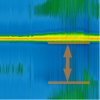
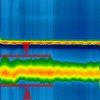
We applied the cyclogram transformation to ECG recordings. Each cardiac cycle becomes a row in the image. Stack them up over time and you get a 2D map of how the heartbeat’s shape evolves — beat by beat.
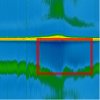
The results are striking. Normal rhythms produce stable, repeating patterns. Arrhythmias, ectopic beats, and waveform changes produce visible disruptions. Features that might take seconds to spot on a scrolling ECG trace are immediately obvious in a cyclogram.
Why This Matters
Standard ECG analysis uses the Fourier transform or template-matching algorithms. These approaches are effective for known patterns but can miss subtle waveform changes that don’t match expected templates.
Cyclograms provide a complementary view: instead of asking “does this beat match a template?”, they ask “how did the shape of the beat change over the last 60 seconds?” That is a fundamentally different — and potentially more sensitive — question.
ECG Visualisation and Navigation — full presentation.