Structural Vibration Analysis
16 March 2011
Machines vibrate. Bearings wear. Shafts flex. Imbalances develop. A rotating machine’s health is encoded in the shape of its vibration signal — and cyclograms make that shape visible across hundreds or thousands of cycles simultaneously.
The Problem with Traditional Approaches
Vibration analysis typically relies on spectral methods — FFT, waterfall plots, order analysis. These are powerful for known fault signatures but require expertise to interpret and can miss transient events or subtle waveform evolution.
The fundamental limitation: spectral approaches answer “which frequencies are present” but not “how did the shape of each rotation change over the past hour?”
What Cyclograms Show
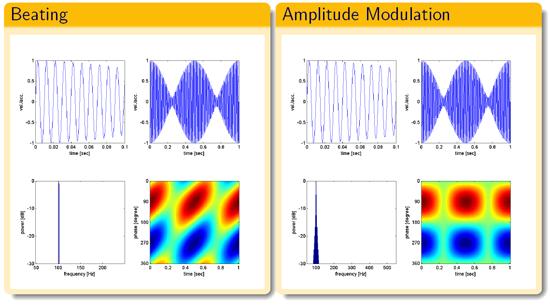
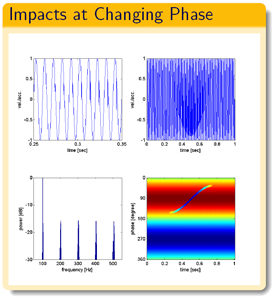
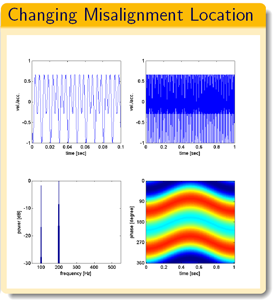
A cyclogram of a machine vibration signal shows every rotation as a row in a 2D image. Time on the horizontal axis, phase within each rotation on the vertical axis, amplitude encoded as colour.
The result: a long-term map of waveform evolution. Bearing wear produces characteristic streaks. Intermittent contact events appear as isolated bright features. Resonance changes produce visible phase shifts across the image. Changes that would require a specialist to spot in a spectrum become visually obvious.
Applications
- Rotating machinery: pumps, motors, gearboxes, turbines
- Structural health monitoring: bridges, wind turbines, pipelines
- Quality control: detecting waveform anomalies on production lines
- Predictive maintenance: identifying the onset of wear before failure
New Methods In Vibration Analysis — presentation held at VANZ 2006.